Navigate
You can see your scores in the ‘Home’ section of the app by clicking on the Risk, Speeding, Distraction, Fatigue, and Eco icons below your Driving Score.
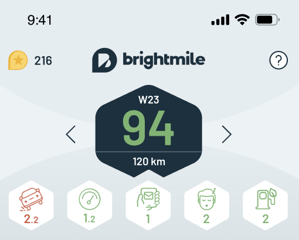
Your company will give you a target score for each of the Five Pillars.
The colour of each Five Pillar icon will let you know how you are doing - green if you are hitting or beating your target, red if you are not
Press any of the icons to see more information on your Five Pillar scores, this includes:
Press any of the icons to see more information on your Five Pillar scores, this includes:
- How the scores are calculated
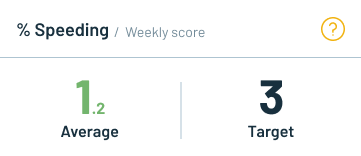
- What your targets are
- How you are doing over time and against your targets
- How you are driving compared to your colleagues
Remember we only calculate these based on your Business Trips.
Trend
For each of the Five Pillars, you can see your weekly average, which restarts every calendar week, compared to your company target.
Longer term progress
We also show you how you are doing over time so you can see how your behaviours change.
The dots on the graphs plot your weekly averages, calculated each calendar week. Any scores that were above your company targets will show in the red section of the graph.
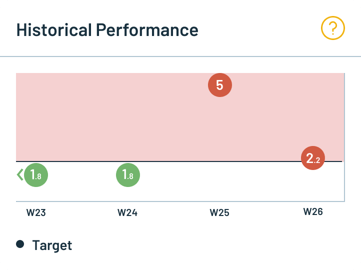
You can swipe on the Graph to see your trend back over the last 10 weeks