The Home screen has the following sections:
Usage stats
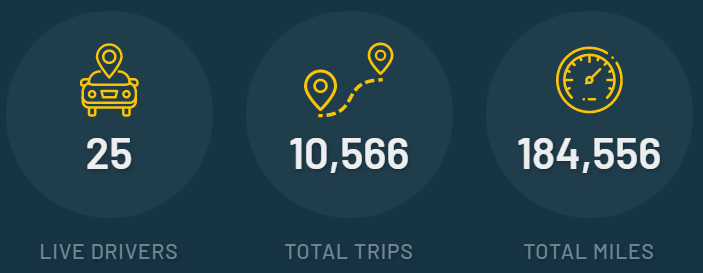
Quickly understand, for the group that you are currently viewing, how many drivers are Live (i.e. logged into the Driver App and recording trips), and how many trips and business miles have been recorded.
Latest Insights
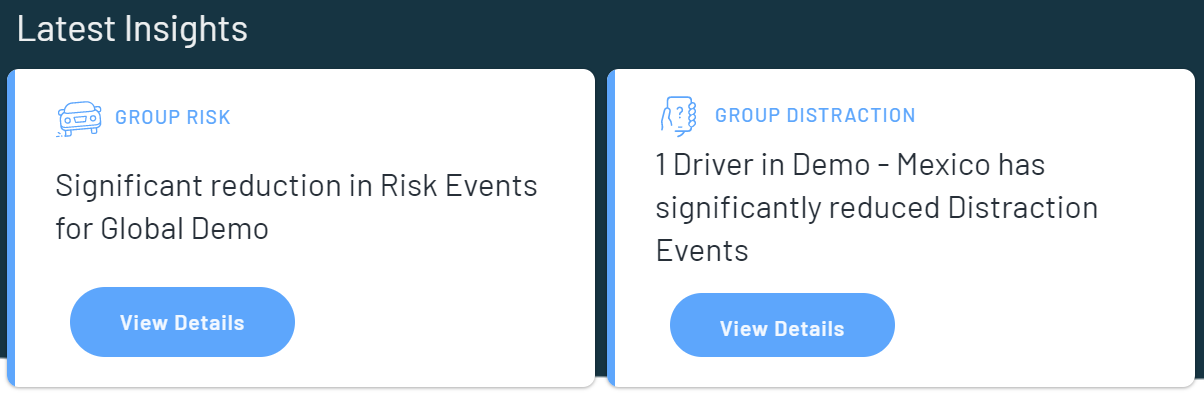
Read the latest insights that have been generated for you to quickly understand priority action items.
Note that insights will not be generated until we have collected sufficient data across your fleet with a large enough set of drivers to be able to derive meaningful insight (i.e. typically around 6 weeks after deployment).
14 Day Summary
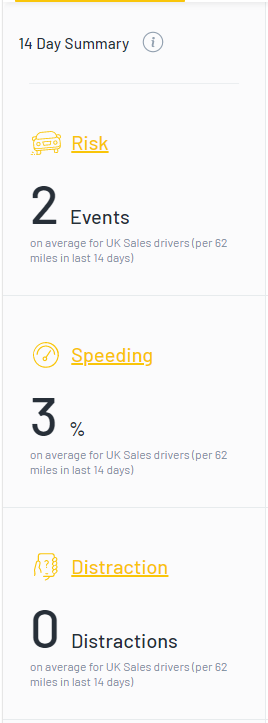 |
Here you can see how the Drivers that you are looking at have performed over the last 14 days across the Five Pillars, giving you a snapshot of current performance.
The 14 day average has been defined by our data scientists as providing the best view of current performance whilst smoothing for day to day variation.
The Five Pillars are as follows:
A Risk Event is triggered when a driver either (a) drives over the legal speed limit at junctions, traffic lights, or school zones, (b) drives too fast to safely corner around sharp bends and winding roads, or (c) drives too fast to safely come to a complete stop at stop sign and give way / yield junctions.
It might sound complicated at first, but to give you a clear view of how your drivers are performing on average over a meaningful distance, the metric we focus on is Risk Events per 62 miles (or 100 kilometres).
We don’t focus on individual events as we feel that it is more effective to look at trends over time and identify Drivers who regularly exceed limits
To give you a clear view of how your drivers are performing on average over a meaningful distance, the metric we focus on is Distraction Events per 62 miles (or 100 kilometres).
|
 |
The Fatigue Pillar measures how many minutes Drivers have driven after 2 hours without taking a break, i.e. when they might be at greater risk of fatigue. [Note that 2 hours is the default but this can be customised per your company’s policy.]
For example, a Driver making a trip of 2 hours and 27 minutes without taking a break would record 27 minutes at risk of Fatigue.
To give you a clear view of how your drivers are performing on average over a meaningful distance, the metric we focus on is minutes driven at risk of Fatigue per 62 miles (or 100 kilometres).
The Brightmile Driver App detects incidents of harsh acceleration and records each incident as an Eco Event.
To give you a clear view of how your drivers are performing on average over a meaningful distance, the metric we focus on is Eco Events per 62 miles (or 100 kilometres).
|
Trends:

This is where we recommend that Managers focus to understand how their Drivers are performing over time.
You can choose between periods of 4 weeks to 6 months to give a view of short and long term trends across each of the Five Pillars.

If you have groups defined for your drivers you can also use this view to compare how a group is performing against other groups or the wider fleet.

Export Data

Press here to export the data that you are currently viewing into a PDF.